From our CIO: A look back at the end of 2024, and what’s ahead
Q4 performance of our Managed Investing portfolios
January 24, 2025
Many of our portfolios posted strong returns in Q4 as asset markets, particularly U.S. stocks, continued their epic rally. It was one of the best years on record, in terms of both returns and return-to-risk ratio, which means the market more or less went up with little volatility. Here’s what happened in our managed portfolios and funds.
Q4 portfolio performance (Oct. 1 - Dec. 31)
| Q4 | 2024 | ANNUALIZED GROWTH SINCE INCEPTION1 |
|---|---|---|---|
Classic Balanced | 2.1% | 15.2% | 5.6% (Jan 2016) |
Classic Growth | 2.8% | 18.9% | 7.8% (Jan 2016) |
SRI Balanced | -1.8% | 8.4% | 4.7% (Sept 2016) |
SRI Growth | -1.7% | 10.8% | 6.6% (Sept 2016) |
Halal Balanced | 0.0% | 14.5% | 7.3% (May 2021) |
Halal Growth | -0.1% | 16.4% | 8.2% (May 2021) |
New: Bond Portfolio | 1.6% | n/a | 2.6%2(July 2024) |
1Inception dates are as of the beginning of the performance composite for each fund
2Bond Portfolio performance through January 3, 2025
Managed Investing portfolio performance
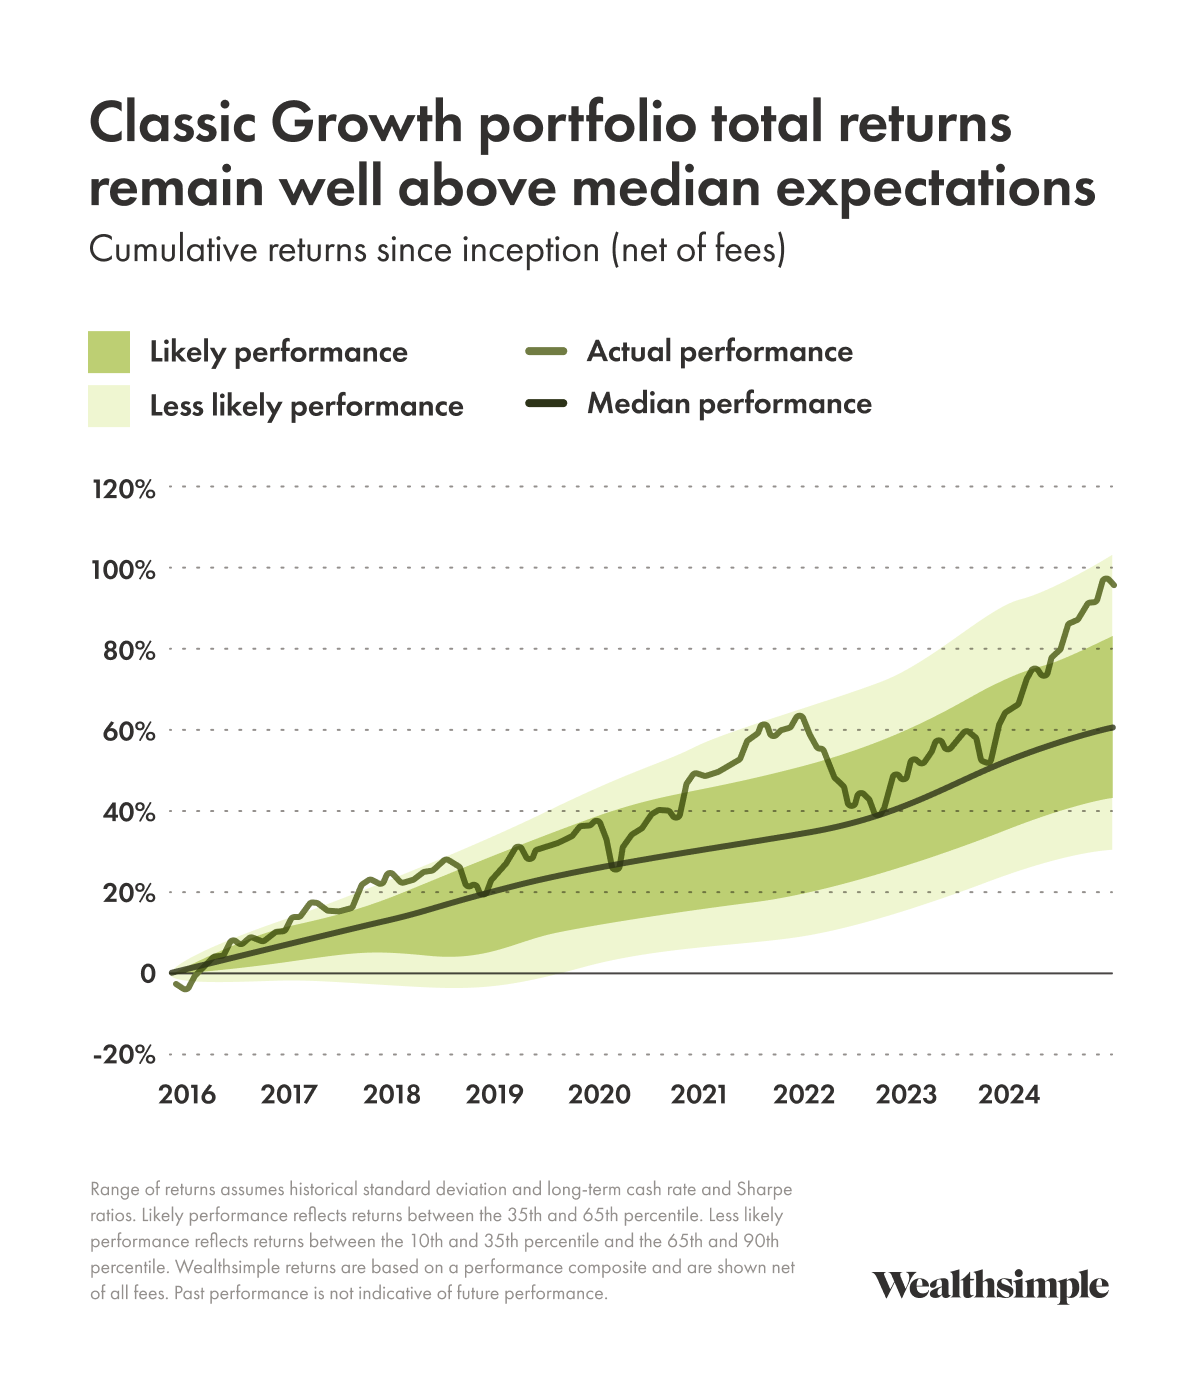
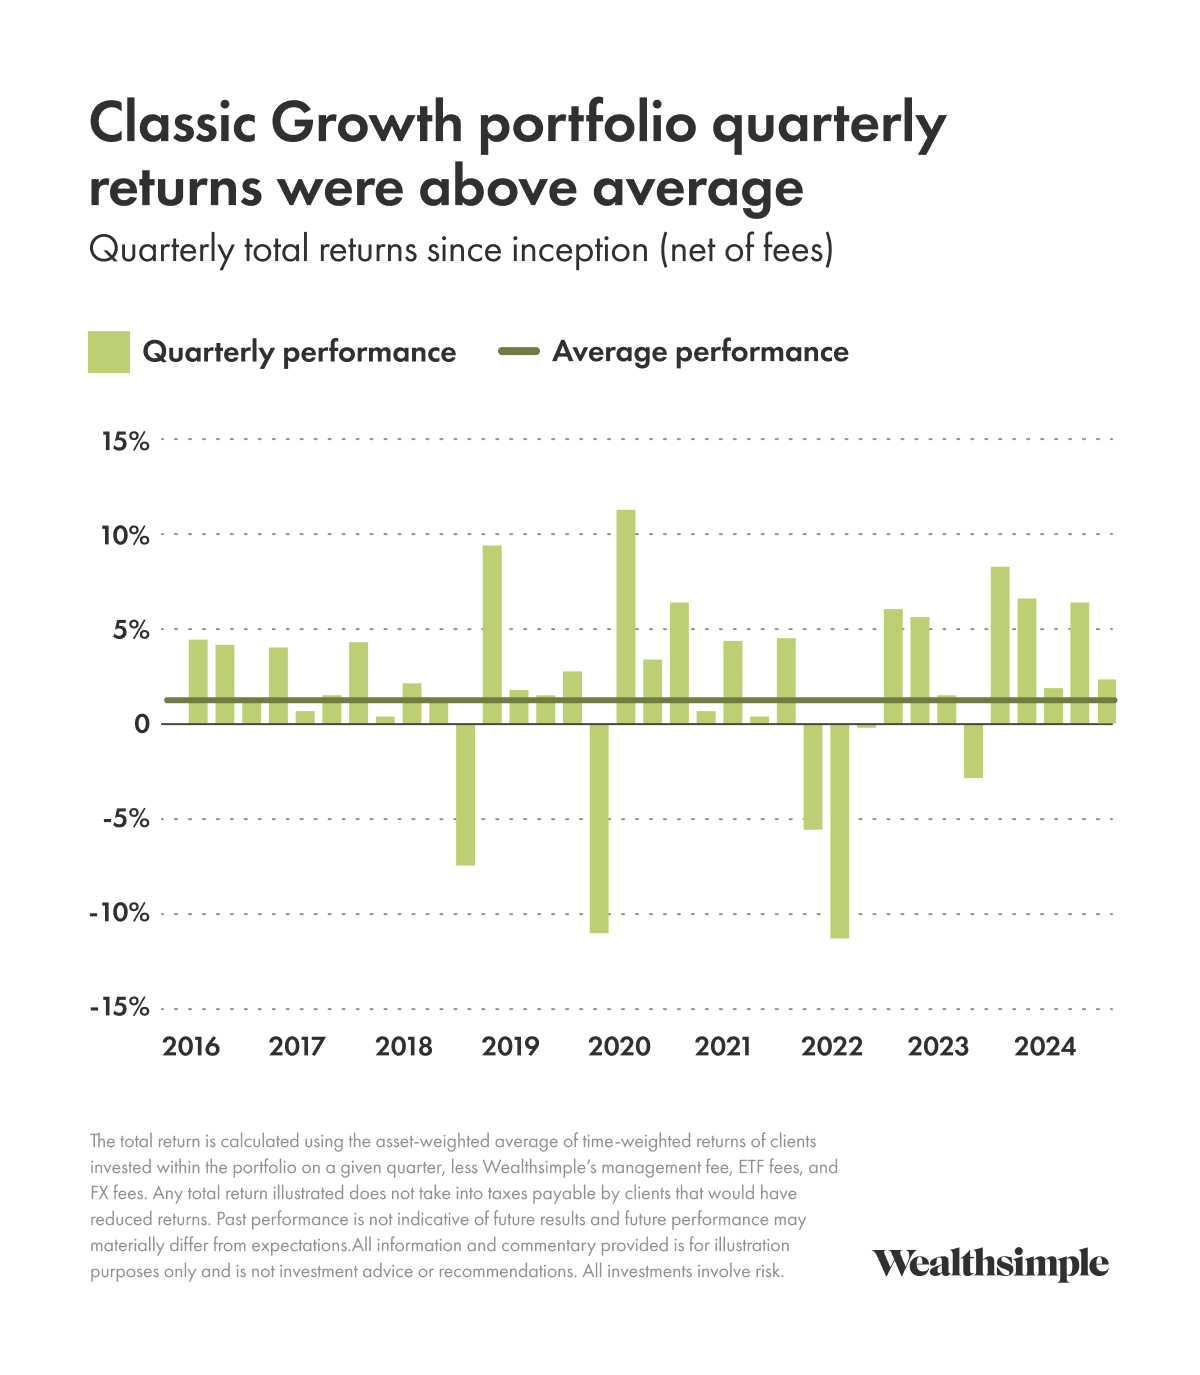
Our strategy is to offer diversified portfolios of assets that perform well at different times in order to maximize our clients’ chances of achieving their investing goals. We do this by adding assets like defensive stocks that offset the typical equity boom-bust cycle over the particular time periods that matter for our investors. We believe that having better returns when markets are weak matters more than having good returns when markets are strong, because extra income matters more to investors when they have less wealth.
Here’s a look at the broader performance of our Classic Growth portfolio.
Alternative investments performance1
These funds allow our clients to invest in private assets that have long been reserved for institutional investors and the ultrarich. They offer higher expected returns or attractive returns and diversification. Both funds are managed by experienced, institutional-quality investors with track records of steady performance across economic cycles and aligned incentives.
Private Credit invests in senior-secured floating-rate loans (that means we’re first in line to get paid back, and payments go up or down with interest rates) to medium-size companies. It returned 10.6% year to date and is distributing income at a 9% annualized rate.2 Annualized total returns since inception in June 2023 are 11.1%. Private credit has been playing its role well in the portfolio as a consistent source of high returns.
Private Equity offers a globally diversified portfolio of private companies owned and operated by private equity managers who work aggressively to improve their value. It returned 4.1% in October and November (December returns are still pending), bringing total returns since inception in January 2024 to 33.3%, which is at the high end of our expectations. For reference, world stocks (which private equity replaces in many portfolios in order to seek higher returns), rose 27.9% during the same period.3
Introducing our new bond portfolio
We launched a bond portfolio in July and have been offering it to more investors steadily since then. The fund is intended for investors who are looking to earn more than they would by keeping their money in a high-interest savings account. It allows you to take some investment risk, while keeping potential losses below those of our multi-asset portfolios, including conservative ones. I’ll be sharing more details soon and hosting a webinar where you’ll be able to ask questions.
The portfolio is currently yielding 4.2%4, which is 0.9% over the current interest rate set by the Bank of Canada. Since inception in late July, it has returned 2.3%, which is 0.7% more than cash returns over the same period.5 These returns are primarily due to investing in floating-rate bonds, whose interest payments reset with short-term interest rates. We have since allocated to some bonds with slightly longer maturities in order to increase diversification.
Our outlook
We build our portfolios based on the principle that investors are rewarded for putting their money at risk. Doing that in a diversified way puts you in an excellent position to have positive returns. One big benefit of this approach is that we don’t have to predict the future (which, as it turns out, is kind of hard to do).
While we don’t know what will happen, we do know what markets expect. By relying on market pricing and simple models, we can estimate what returns will be if those expectations pan out. This gives us a reasonable starting point for where we think various assets might be headed this year. Here’s where those expectations currently stand6:
- Cash: +2.8%
- Government bonds: +3.2%
- Investment Grade Credit: +3.9%
- Developed world stocks: +7.8%
These numbers are based on average historical returns relative to starting pricing. And if we know one thing, it’s that we won’t get the average across asset classes. Something surprising will probably happen. This is why diversified risk taking — across countries, types of stocks, and asset classes — helps maximize your odds of investing success.
The possible effects of President Trump’s proposed tariffs
For those of you wondering about U.S. President Donald Trump’s recent announcement that a 25% tariff could be imposed on Canada in February, here’s my general take:
If a tariff were implemented as described, the impact on the Canadian economy could be significant. 70% of our exported goods go to the United States, and 33% of the GDP is exported. If Canada issued retaliatory tariffs as has been suggested, the prices of American goods would rise. One estimate showed inflation increasing by 2% in response. Another showed significant job losses.
In terms of the markets, the reaction has been muted so far, signaling that, 1) market participants may see this as more of a threat than something they expect to be implemented, or 2) some of this is already priced in. Although we would expect large tariffs to cause declines in the value of the Canadian dollar and Canadian stocks, and an increase in the value of Canadian bonds on growth concerns, investors in an internationally diversified portfolio should see a small impact. Trade flows, while large for Canada, are a small part of the U.S. economy, and the decline in the value of the Canadian dollar would increase the value of assets held in U.S. dollars. We would expect other factors, like U.S. economic growth and inflation, and the outlook for AI, to have a larger impact on market returns than tariffs.
It’s an evolving situation and we will update you as we learn more.
Need help? We’re here for you. Contact our team.
Legal
1Returns shown for Private Credit and Private Equity funds include all applicable fund management fees and performance fees, but excludes Wealthsimple’s standard management fees for its advisory services. Past performance does not guarantee future results.
2Annualized distribution yield based on $0.077/share, divided by NAV of $10.269 (as of November 30, 2024), and multiplied by 12. To calculate this rate, we take a partial year distribution and convert it to a full-year amount as if it were paid in each period. We then divide this annualized amount by the fund’s value at the start of the period. Distributions are not guaranteed. Past performance does not guarantee future results.
3Based on MSCI All Country World Index from December 31, 2023 to November 30, 2024. The past performance of private equity or any other security or investment strategy is not an indicator of future performance, and past performance may not be repeated. This is for informational purposes and does not constitute investment advice. All investments involve risk.
4The current yield for the Bond ETF portfolio is calculated based on annualizing the most recent dividend payments and the latest available ETF prices at the time of the calculation. The yield presented represents a weighted average of the individual ETF yields, with each ETF's yield weighted according to its proportion within the portfolio, taking into account the management expense ratio (MER) fees of the ETFs but excluding Wealthsimple's standard management fees for its advisory services. This yield information is updated on a monthly basis, and the current data is as of January 22, 2025. Please note that the yield is subject to change due to fluctuations in dividend payments, ETF prices, and portfolio composition. Past performance is not indicative of future results.
5As compared to Global-X 0-3 Month Treasury Bill ETF Total Returns from July 20, 2024 to January 3, 2025. The past performance of the Bond ETF portfolio and any other security or investment strategy is not an indicator of future performance, and past performance may not be repeated. Comparison is for informational purposes and does not constitute investment advice. All investments involve risk.
6Return forecasts based on: cash: OIS curve compounded over 10 years; government bonds: 10-year bond yield to maturity; Canadian corporate bonds: current BBB Canadian bond yield adjusted for expected credit losses; and stocks: Canadian 10-year bond yield plus equity risk premium as calculated by Aswath Damoradam here. Data from Bloomberg unless otherwise noted.